Water Treatment Plant In India – Swach Env

Current Articles

Wash Your Hands To Fight Coronavirus And Stay Safe
With the COVID-19 pandemic hitting various parts of the world, people can now feel the importance of the Global Handwashing Day celebrated on October 15th every year. Coronavirus can spread very easily from an infected person if he fails to follow proper hygiene practices. One of the most important and common precautionary steps suggested by the government to prevent the spread of coronavirus is hand washing.

Importance Of Hand Washing
Since coronavirus can spread through tiny droplets from an infected person when he coughs or sneezes, touching infected surfaces can spread the infection even further. People keep on touching various surfaces irrespective of them being in their home or travelling. If you don’t want the virus to enter your body, make sure you wash your hands whenever you touch a surface which might be infected.

Use soap and water to wash your hands frequently. You can also use an alcohol-based hand rub as they are quite effective in killing viruses on your hand. Please don’t touch your nose, mouth or eyes before you have washed your hands properly and sanitized it.

When Should You Wash Your Hands?
1. After sneezing or coughing
2. Before and after preparing food
3. After caring for the sick
4. Your hands are dirty
5. After using the toilet
6. Before eating your food

Time to follow proper handwashing techniques and you can fight the Covid-19 pandemic better.

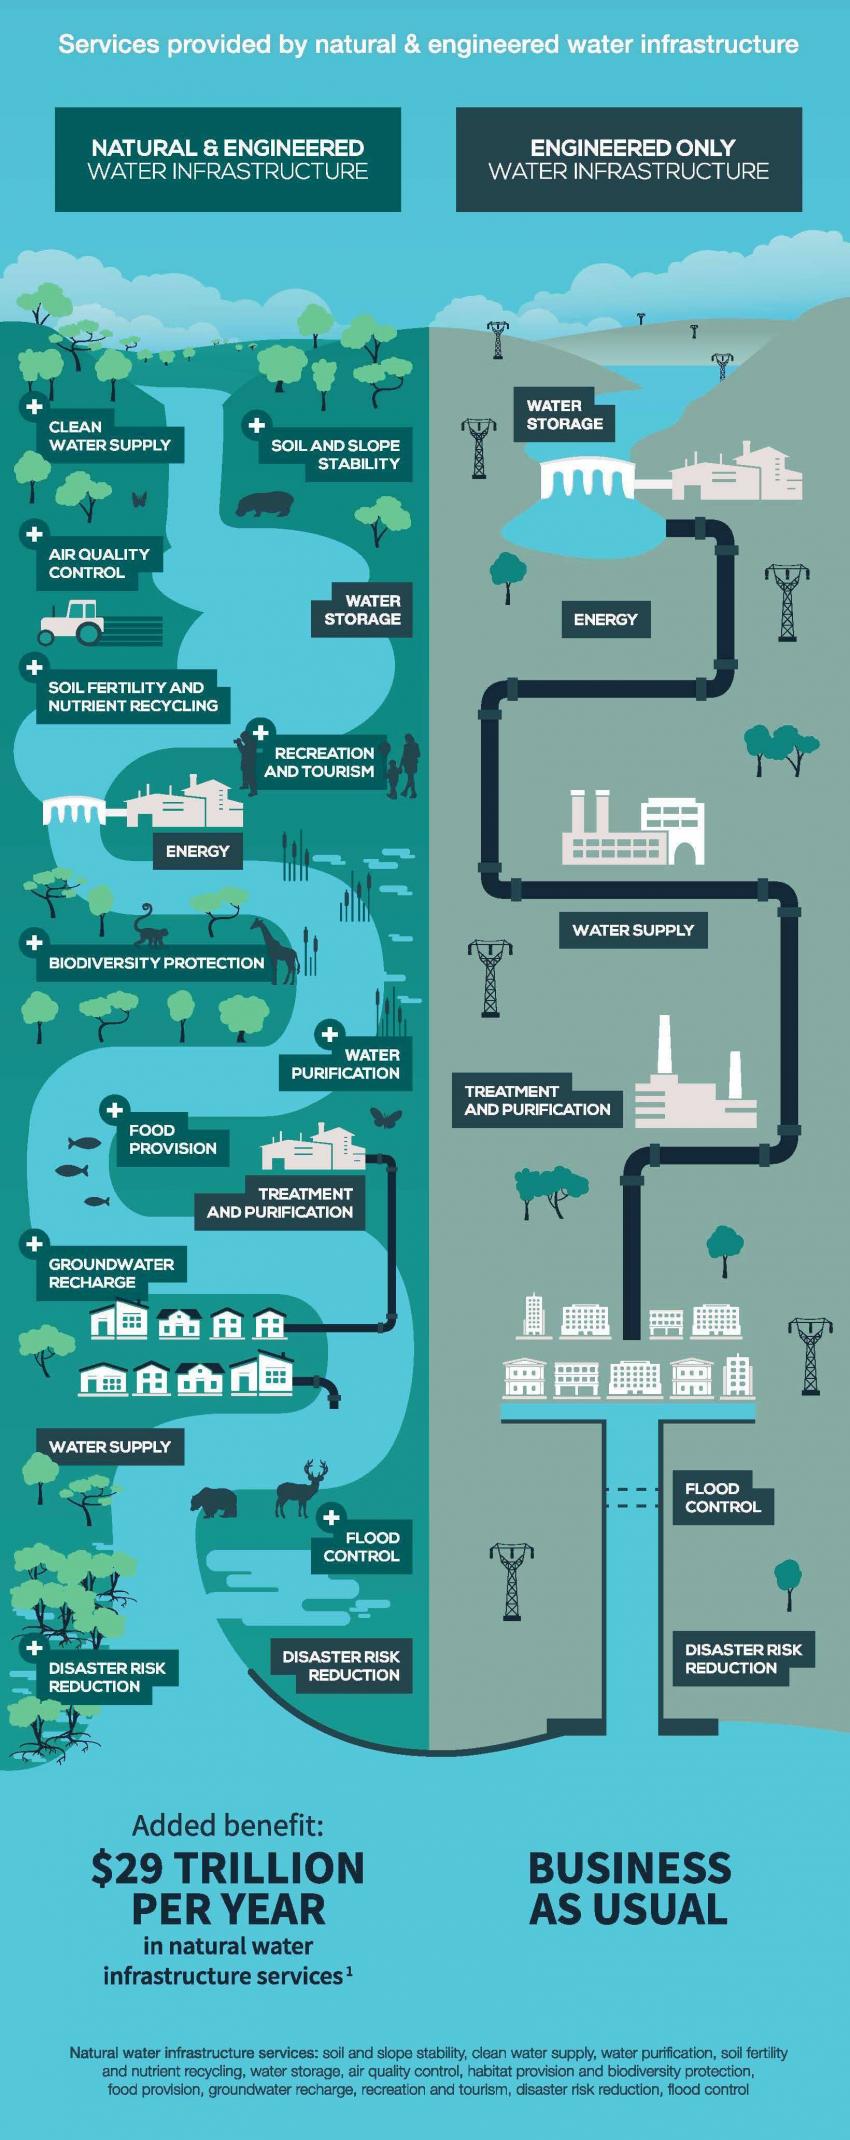
The idea of a sponge city is simple – rather than using concrete to channel away rainwater, you work with nature to absorb, clean and use the water.

“Floods are not enemies,” explains Professor Kongjian Yu. “We can make friends with floods. We can make friends with water.”

What we have done is totally wrong, he says. He returned to China after studying landscape architecture at Harvard University in the US, determined to tackle one of the biggest problems facing cities.

His solution was to work with nature rather than against it.

Natural flow

Eco-friendly terraces allow land and water to meet, explains Kongjian, or “the Sponge Cities Architect” as he’s known.

During the dry season, the terrace is a park for residents to enjoy. But during the rainy season it can flood, protecting the city without the need for grey infrastructure like flood walls or dykes.

Not only does this safeguard the city by working with nature, but the water is clean, vegetation can grow and a habitat is created for wildlife.

It’s not just wetlands and restored riverbanks, though. Sponge cities also include green walls and roofs, permeable pavements and green buildings.

All from one city

And it all began in just one Chinese city, 20 years ago.

Today, 250 places in the country are working with Kongjian and his team, as well as urban areas everywhere from the US and Russia to Indonesia.’

It’s an inherently global answer to a problem that afflicts a variety of places, he believes. “The ecological-based or nature-based solution can be a solution global-wise.”

Source: World Economic Forum

The evolution of the plastic bottle from amazing to scourge of land and sea has played out inside of a generation.

The moment the modern plastic beverage bottle changed the world’s drinking habits is difficult to pinpoint. The day New York supermodels began carrying tall bottles of Evian water as an accessory on fashion show catwalks in the late 1980s surely signaled the future ahead. Billions of bottles were sold on the promise that bottled water is good for hair and skin, healthier than soft drinks and safer than tap water. And it didn’t take consumers long to buy into the notion that they needed water within reach virtually everywhere they went.

What sets bottles apart from other plastic products born in the post-World War II rise of consumerism is the sheer speed with which the beverage bottle, now ubiquitous around the world, has shifted from convenience to curse. The transition played out in a single generation.

“The plastic bottle transformed the beverage industry and it changed our habits in many ways,” says Peter Gleick, co-founder and president emeritus of the Pacific Institute in Oakland, California, and author of Bottled and Sold: The Story Behind Our Obsession with Bottled Water.

“We’ve become a society that seems to think if we don’t have water at hand, terrible things will happen. It’s kind of silly. It’s not as though anybody died from thirst in the old days,” he says.

By 2016, the year sales of bottled water in the United States officially surpassed soft drinks, the world had awakened to the burgeoning crisis of plastic waste. The backlash against the glut of discarded bottles clogging waterways, polluting the oceans and littering the interior has been swift. Suddenly, carrying plastic bottles of water around is uncool.

What is cool is wearing them: Hip fashion translates into designer clothes made of recycled water bottles. There’s even a growing market of luxury, stainless steel refillables, including a limited-edition bottle covered with thousands of Swarovski crystals that sells for almost $2,000.

Plastic bottles and bottle caps rank as the third and fourth most collected plastic trash items in the Ocean Conservancy’s annual September beach cleanups in more than 100 countries. Activists are zeroing in on the bottle as next in line for banning, after plastic shopping bags. The tiny towns of Concord, Massachusetts and Bundanoon, Australia already have banned bottles, as have numerous public parks, museums, universities, and zoos in Europe and the United States.

The developing world—where 2.2 billion people still do not have access to clean drinking water, according to the United Nations, and bottled water is often the only safe option—is getting out ahead of the problem. In June, Kenya announced a ban on single-use plastics at beaches and in national parks, forests, and conservation areas, effective in June 2020, and the South Delhi Municipal Corporation banned disposable water bottles in all city offices.

A brief history

Consumers have been drinking bottled beverages for more than a century, first in glass bottles, then in steel and, later, aluminum cans. Early plastic bottles showed promise as a lightweight alternative, but they leached chemicals and failed to contain carbonated drinks. If the bottle didn’t explode, the carbonation fizzled. It wasn’t until the 1970s when a miracle plastic known as PET came along and changed the game.

Polyethylene terephthalate has been around since 1941. Du Pont chemists developed it while experimenting with polymers to make textiles. In 1973 Nathaniel Wyeth, another Du Pont scientist, patented the first PET bottle. It was lightweight, safe, cheap—and recyclable. In other words, it was the perfect container to set the stage for the bottle binge that followed.

Perrier and Evian crossed the Atlantic at around that time, launching the bottled water craze. PepsiCo finally joined the water business and introduced Aquafina in 1994. Coke followed with Dansani in 1999. Both brands use refiltered tap water. Between 1994 and 2017, water sales in the United States had grown by 284 percent, according to Beverage Marketing Corp. data published by the Wall Street Journal.

Between 1960 and 1970, the average person bought between 200 and 250 packaged drinks ever year, Elizabeth Royte reported in her book Bottlemania,citing data from the Container Recycling Institute. Most of those purchases, she added, involved refillable bottles. As of 2017, on a global scale a million plastic beverage bottles were purchased every minute, according to data from Euromonitor International’s global packaging trends report, published in 2017 by The Guardian. Today, plastic bottles and jars represent about 75 percent of all plastic containers, by weight, in the United States, according to the Plastics Industry Association.

Ramani Narayan, a chemical engineering professor at Michigan State University, cautions that to focus entirely on the numbers and overuse of plastic bottles is to miss the essence of the problem.

“There is an overuse of plastic bottles that needs to be curtailed,” he says. “But the problem is misuse of bottles at the end of their life. The issue is recovery of the product and incentives to recycle, and the commitment on the part of regulators, as well as brand owners, to only use bottles that contain at least 50 percent recycled plastic. Or 60 percent. They are not making that commitment.”

New life for bottles

As the public’s focus on the plastic waste crisis narrows, the world is awash with solutions for bottles. Generally, they fall into two categories: efforts to reduce the use of plastic bottles and efforts to find new ways to deal with bottles once they’re thrown away.

Just in London, efforts to reduce plastic bottles abound. Mayor Sadiq Khan announced plans to build 100 new fountains for refillable bottles. Last spring, runners in the London Marathon were handed edible seaweed pouches at mile 23 containing a sports drink to slake their thirst. And Selfridges, London’s century-old department store, has vanquished plastic beverage bottles from its food court in favor of glass bottles, aluminum cans, and refilling stations.

Once bottles have become trash, entrepreneurs around the world are turning them into printer ink cartridges, fence posts, roofing tiles, carpets, flooring, and boats, to name only a few items. Even houses have been constructed from bottles. The latest is a three-story modern on the banks of the Meteghan River in Nova Scotia, promoted as able to withstand a Category 5 hurricane. It only took 612,000 bottles.

In laboratories, new versions of bottles claiming to be biodegradable or compostable appear regularly, and plastic industry chemists are experimenting with “chemical recycling” that returns the polymers to their constituent monomers, enabling them to be remade multiple times into new plastic bottles.

Many of the solutions are not scalable to a level that would make a noticeable difference, and most of them—including biodegradables—still require that the most elemental and least functional part of the bottle’s lifespan be performed: Someone needs to pick them all up.

Recycling rates remain low. In 2016 fewer than half the bottles bought worldwide were collected. In the United States, new PET bottles contain only 7 percent recycled content, said Susan Collins, executive director of the Container Recycling Institute. Although consumers of soft drinks dutifully returned glass bottles and collected the refund in the decades before PET was invented, beverage companies have long strongly promoted recycling, and vigorously opposed bottle deposit legislation, arguing bottle bills cost them too much money.

Beverage companies have pledged to use more recycled bottles in manufacturing, a goal that aims to reduce the production of new resin and boosts recycling numbers by adding value to bottle recovery.

PepsiCo pledged to increase recycled content in all its plastic packaging 25 percent by 2025. Nestle Waters vowed to make all of its packaging recyclable by 2025 and increase recycled content in bottles to 35 percent by 2025 globally and to 50 percent in the United States, focusing on Poland Spring. Additionally, recycled content for European brands will increase to 50 percent by 2025.

Coca-Cola pledged to recycle a used bottle or can for every one the company sells by 2030 and increase recycled material in plastic bottles to 50 percent by 2030.


Source: National Geographic


Poor sanitation at Govardhan Parvat

The National Green Tribunal (NGT) on August 19, 2019 expressed displeasure over absence of officers at temples and areas in Govardhan Parvat like Parikrama Marg, Mansi Ganga, Daan Ghati and other temples that are, cleanliness wise, in a dismal state. The tribunal was hearing a case on the poor state of sanitation at the hill.

Court Commissioner Anand V Shukla visited the site on two festivals and reported that the religious place follows no rules when it comes to cleaning garbage and removing it from temples. Also, he reported that sound systems played there whole night, without any check.

As the festival of Janmashtami is near, the NGT directed Mathura’s district magistrate, senior superintendent of police, sub-divisional magistrate and other concerned officers “to camp at Govardhan for two days — August 20 and 21 — and ensure that all garbage, and other issues of cleanliness in Parikrama and other temples be resolved”.

Since Parikrama Marg is in Rajasthan, the tribunal asked Bharatpur’s divisional commissioner, SP and SDO-Deeg to appear before it on August 28, the next date of hearing.

Environment audit on ship breaking method

The NGT asked the Union Ministry of Environment, Forest and Climate Change (MoEF&CC) to conduct an environment audit on the impact of ship-breaking method within three months.

The tribunal, in its order of August 19, 2019, said the audit has to be conducted either by the National Institute of Oceanography or National Environmental Engineering Research Institute (NEERI) and should be in compliance of Coastal Regulation Zone notification. The study has to be completed within three months.


Source: Down To Earth

August 16, 2019

On the sandy embayments rimming the southwestern English coastline, beachcombers can find a wide array of stones, from tiny pebbles to hefty paperweights, strewn amidst the flotsam. They’re a rather unremarkable looking bunch; a palette of grays offset with the occasional swirl of color, smooth on their surfaces and rounded at the corners.

But start picking them up and handling them, and you’ll soon discover that some of these seemingly nondescript rocks aren’t rocks at all.

This is pyroplastic—a newly described form of plastic pollution that was transformed by fire. Even geologists are often confounded by its appearance. To Andrew Turner, an environmental scientist at the University of Plymouth who described the substance in a recent paper in Science of the Total Environment, that suggests pyroplastics may be hiding in plain sight all over the world.

“Because they look geological, you could walk by hundreds of them and not notice,” Turner says.

Rock Imposters

Turner first caught wind of this strange new addition to the lineage of human litter several years back, when he was contacted by volunteers with the Cornish Plastic Pollution Coalition, a constellation of groups that organize cleanups on the heavily touristed beaches of Cornwall County.

Beachcombers were turning up strange facsimiles of pebbles and stones—plastic impersonators that were light enough to float in water. Some volunteers, Turner says, had collected thousands of them. Environmental artist and Cornwall native Rob Arnold even created a display for a local museum that tasked visitors with spotting the real rocks amidst the plastic. Very few could.

“It was very successful and quite a shocking really,” Arnold says. “People were just amazed this pollution was out there and they hadn’t seen it.”

About a year ago, Turner decided to study the phenomenon more systematically. While he received samples from Scotland to British Columbia after putting a call out on social media, his analysis ultimately focused on a collection of litter gathered along Whitsand Bay, a large, protected embayment that contains some of Cornwall’s best beaches. After taking some size and density measurements, his team examined the plastics’ chemical makeup using X-ray and infrared spectroscopy.

The “stones,” they learned, were made of polyethylene and polyproplyene, two of the most common forms of plastic. They also contained a smorgasboard of chemical additives, but the one that jumped out at the researchers most was lead, which often appeared alongside chromium.

Turner believes these are the traces of lead chromate, a compound manufacturers added to plastics decades ago to give them a vibrant yellow or red coloration. Those colors, he says, were likely dulled by burning, an idea his team tested by melting down some brightly colored plastics in the lab. Sure enough, they turned a dark gray.

Years of erosion by wind and water, meanwhile, could explain the pyroplastics’ smoothed edges and weathered look.

“If you can imagine a pebble being geologically altered, it’d take hundreds of thousands of years,” Turner says. “I think we’re seeing the same thing on these plastics but occurring much more quickly.”

Murky origins, uncertain futures

Where exactly the Cornwall pyroplastics originated is still a mystery. Turner suspects there could be many sources, from campfires—which have been implicated in the formation of a plastic-rock hybrid called plastiglomerate in Hawaii—to old landfill sites. Some of the stuff may have floated across the English Channel from the island of Sark—where recent reports indicate waste is being burned and dumped at sea—or all the way from the Carrbbean.

Regardless, pyroplastics are out in the world now, and Turner wonders what sorts of environmental hazards they could pose. Several of his samples contained worm tubes that appeared to be enriched in lead, suggesting animals can ingest the plastic and may be introducing heavy metals into the food chain.

Turner has shared some samples with a colleague in the United States who is conducting additional analyses to see whether they contain harmful organic compounds as well.

“If you burn plastic in uncontrolled environment, it can generate all sorts of nasty substances,” he says.

Beyond the immediate ecological effects, pyroplastic stands as yet another indicator of plastic’s ubiquity in the environment. Jan Zalasiewicz, a professor of paleobiology at the University of Leicester, wonders whether the stuff will wind up leaving a fingerprint in the rock record—sandwiched perhaps, alongside the traces of chicken bones and radioactive dust that will demarcate our fleeting geological moment.

Whatever fate ultimately befalls pyroplastics, it’s clear to Zalasiewicz that plastics are “becoming part of the geological cycle.”

“They even look like rocks now,” he says.

Source: National Geographic

If there is any more evidence that deniers need about the existence of climate change, they should look at the 2019 southwest monsoon season.

The monsoon has played truant this entire season. It began with a week’s delay after which it had a sluggish start with a decreased intensity up until the first week of July.

The delay was caused either by the extended presence of westerly winds, especially western disturbances, in the northern parts of the country or by the presence of weak El Niño conditions in the equatorial Pacific Ocean.

El Niño is the unusual warming of the equatorial Pacific Ocean and disrupts global wind patterns affecting climatic conditions in tropical areas like Africa, sub-tropical areas like India as well as the extra-tropical areas like North America.

It has a strong correlation with the southwest monsoon season in India but no direct cause and effect. According to DS Pai of the India Meteorological Department (IMD), El Niño could have had a role to play in this delay. But sometimes, the monsoon has arrived early even during El Niño years so nothing can be said for sure.

The progress of the monsoon in June, 2019. The legend values are between 0 to 7. The frequency of value says 7, which means it has repeated 7 times with rainfall category >124.4mm which is noticed in parts of Mumbai and Meghalaya including Cherrapunji. Photo: International Water Management Institute, Colombo

The progress of the monsoon in June, 2019. The legend values are between 0 to 7. The frequency of value says 7, which means it has repeated 7 times with rainfall category >124.4mm which is noticed in parts of Mumbai and Meghalaya including Cherrapunji. Photo: Giriraj Amarnath/International Water Management Institute, Colombo

By June 18, the monsoon winds had not moved past Kerala and Karnataka. The slow progress of the monsoon winds was brought about by the development, propagation and dissipation of very severe Cyclone Vayu in the Arabian Sea over nine days from June 9 to June 17.

The winds of the cyclone disrupted the regular trade winds in the region, which are the carriers of monsoon. This kept the monsoon arrested in Kerala, Tamil Nadu and Karnataka till June 21.

Only when these winds blow at a normal speed, can the monsoon progress into the Indian Subcontinent. Due to this, the country-wide deficit in rainfall until June 18 stood at 44 per cent.

The formation of a cyclone during the monsoon season usually indicates warmer-than-usual sea surface temperatures which means that the temperature difference between land and sea was reduced. This could also cause the monsoon winds which specifically depend upon this difference to not move forward.

The scanty rain scenario changed in the last week of June when some regions had started receiving intermittent rainfall. Due to this, the rain deficit figure dropped to 33 per cent by June-end and 28 per cent by July 3.

The first heavy spell of rains began around July 7. Up until then, rainfall deficiency was 40 per cent or more in 266 districts. For nearly half of them, the deficiency was greater than 60 per cent; in 46 districts it exceeded 80 per cent.

Many of the high-deficit districts were in north India, where the monsoon arrived recently, but the situation was dire even in the south and the east, where the winds have been there for a while.

Kerala and Tamil Nadu, where the monsoon arrived by June 8, were reeling under large deficits of 45 and 48 per cent respectively. After this extended period of lull, the rains suddenly changed character and heavy rains with isolated incidents of extremely heavy rainfall were recorded in the eastern and north eastern parts of the country.

In July the message is same, but there was more frequency of rainfall category >124.4mm across the Western Ghats and Northeast India. Photo: IWMI, Colombo

In July the message is same, but there was more frequency of rainfall category >124.4mm across the Western Ghats and Northeast India. Photo: Giriraj Amarnath/IWMI, Colombo

These spells were intense and crowded over a few days which precipitated floods in many regions across the country killing hundreds of people, displacing millions and impacting their livelihoods.

The first states to face the wrath of rain were Bihar and Assam. In Bihar alone, more than a hundred lives were lost and 7.2 million people were affected. Till July 7, as many as 27 of the 38 districts in Bihar recorded over 40 per cent deficit rainfall. Over the next week, seven of these rainfall-deficit districts were under flash floods.

The second spell of heavy rains began in the first week of August. Due to these, Kerala, Karnataka, Andhra Pradesh, Maharashtra, Gujarat and Goa have suffered the fury of floods. In Kerala, 88 people have died in rain related incidents in the past week.

Currently, the rains are on a break in the state but IMD has already issued a red alert for heavy rains in many districts in the coming days.

If this is not climate change, what is?

One important aspect that showcases the changing character of the monsoon in recent years is the distribution of rainfall. When IMD had declared in mid-May that the monsoon would have a delayed onset, its officials had assured that this would not affect the distribution of the rains, which has not been the case.

The frequency value between 0 to 18 with a combined month of June and July. Photo: IWMI, Colombo

The frequency value between 0 to 18 with a combined month of June and July. Photo: Giriraj Amarnath/IWMI, Colombo

Many regions have had very less rainfall for extended periods of time and when it has indeed occurred, it has been aplenty. The usual nature of a monsoon with rains occurring frequently over an extended period in time can no longer be seen. This has pushed these areas to be either under drought or flood at any given point of time.

The IMD was also not sure about the existence of weak El Niño conditions up until March. This is when forecasters from around the world had declared that the conditions were prevalent since early this year.

Even when IMD finally declared that the conditions were prevalent, it had said that they would abate by early summer. But El Niño has persisted and continues till date. The temperatures will come back to warm neutral conditions only by the end of the monsoon, if at all IMD gets it right this time.

The relationship between El Niño and the distribution of monsoon rainfall remains tenuous but some research has indicated a strong correlation. A study published last year in the journal Climate Dynamics had established that the distribution of rainfall over the Indian Subcontinent has large scale patterns which are influenced by global sea surface temperature anomalies like the El Niño.

But more research is required on the subject to ascertain how exactly the different phases of El Niño impact the distribution of rainfall in India, especially during monsoons and to what extent global warming might be playing a part in this.


Source: Down To Earth

Ocean Acidification, explained

BY

The oceans are growing more acidic, and scientists think the change is happening faster than at any time in geologic history.

That’s bad news for most creatures that live in the ocean, many of which are sensitive to subtle changes in acidity of their watery habitat. It’s especially problematic for corals, oysters, and other creatures with delicate carbonate shells or skeletons, which are weakened by even very slight changes in the ocean’s acid balance—similar to the way acid rain corrodes stone gargoyles and limestone buildings.

Carbon is the culprit

The oceans have always both absorbed and spit out carbon dioxide, shuttling the carbon back and forth from atmosphere to water. But the exchange occurred slowly, generally over thousands or tens of thousands of years.


Humans have disturbed that slow exchange. Since the start of the Industrial Revolution, in the middle of the 18th century, humans have added some 400 billion tons of carbon to the atmosphere. That’s a byproduct of the vast amounts of fossil fuels we burned for energy, the trees that have been cut down, the cement we’ve produced, and more.

Most of that carbon, in the gas form of carbon dioxide (CO2), stays in the atmosphere, where it traps heat and contributes to planetary warming. But each year, the ocean sucks up about 25 percent of all the extra CO2 emitted. Over the last few hundred years, about 30 percent of all the extra carbon dioxide humans have added to the atmosphere has percolated down into the oceans.

That’s a good thing for the atmosphere. Without that extra carbon dioxide drawdown, the planet would have heated up even more than it already has. But it’s bad news for the oceans.

Oceans acidify in the blink of a geologic eye

In the late 1700s, the oceans had equilibrated to be slightly alkaline, with a pH of about 8.1—roughly the same level of acidity as an egg white. (More acidic things fall lower on the pH scale. Perfectly distilled water is about 7 on the pH scale; lemon juice and vinegar measure a mouth-puckering 2 to 3).The ocean’s pH has shifted on geologic time scales. During cold stages in the planet’s past, it crept up (became more alkaline) by something like 0.2 pH units, and it crept down (became more acidic) by about the same amount when the planet warmed up. But it took tens of thousands of years for those changes to happen—plenty of time for creatures living in the seas to adjust to the change.

A large school of horse-eye jack fish swim in the Cabo Pulmo Nature Reserve in Baja, Mexico, created in 1995. Since the coral reef there was protected, marine life has rebounded to levels seen on pristine coral reefs. The surface oceans have recorded about 0.1 pH unit drop since the start of the Industrial Revolution—a blink of the eye in geologic or evolutionary time. While 0.1 units might not sound like much change, it’s significant: Because the pH scale is logarithmic (like the Richter Scale for earthquakes), that small shift actually means that the water is about 28 percent more acidic than it was before.

The future is not bright

This fast change is stressing out the things that live in the sea. It softens the shells of scallops. It slows the molting of crabs, lobsters, and more. It weakens corals. It confuses fish, disturbing their sense of smell. It may even change the way sounds transmit through the water, making the underwater environs slightly noisier.

The future holds even more challenges. By 2050, scientists predict that 86 percent of the world’s ocean will be warmer and more acidic than anything in modern history. By 2100, the pH of the surface ocean could drop to under 7.8, or more than 150 percent compared to today’s already-corrosive state—and potentially even more, in some particularly sensitive parts of the planet, like the Arctic Ocean.

Source: National Geographic

(4th July, 2019)

The Economic Survey 2018-19 has said as far as agriculture is concerned, the country should shift its focus from land productivity to irrigation water productivity and on devising policies to incentivise farmers to adopt efficient ways of water use.

This should become a national priority to avert a looming water crisis.

Agriculture remains the predominant occupation in terms of number of people employed. Also, agriculture is dependent highly on water. So, appropriate mechanism needs to be framed for economical use of water among small and marginal farmers, said the Survey.

“The cropping pattern in India is highly skewed towards crops that are water-intensive. The incentive structures like minimum support price, heavily subsidised electricity, water and fertilizers have played a significant role in the misalignment of crop patterns in the country,” said the Survey, adding that the water guzzlers, paddy and sugarcane, consume more than 60% of irrigation water available in the country, reducing water availability for other crops.

The survey said States such as Tamil Nadu, Karnataka, Maharashtra and Andhra Pradesh, which have high land productivity, tend to have very low irrigation water productivity, reflecting inefficient use of water and the need to re-calibrate cropping pattern.

“Adopting improved methods of irrigation and irrigation technologies will have a critical role in increasing irrigation water productivity,” it said.

Source: The Hindu

(1st  july, 2019)

Inspired by the Hon’ble Prime Minister’s impetus on Jal Sanchay, the Jal Shakti Abhiyan (JSA) is a time-bound, mission-mode water conservation campaign. The JSA will run in two Phases: Phase 1 from 1st July to 15th September 2019 for all States and Union Territories; and Phase 2 from 1st October to 30th November for States and UTs receiving the retreating monsoon (Andhra Pradesh, Karnataka, Puducherry and Tamil Nadu). During the campaign, officers, groundwater experts and scientists from the Government of India will work together with State and district officials in India’s most water-stressed districts for water conservation and water resource management by focusing on accelerated implementation of five target intervention. The JSA aims at making water conservation a jan andolan through asset creation and communication campaign.

Source: Ministry of Jal Shakti